

Data Viewer
Overview
At PlaceIQ, I had the opportunity to redesign the Data Viewer, an internal platform used by data analysts and the data science team to get insight into our audiences and data sources. I worked closely with a data scientist and a developer to learn about the existing platform and the frustrations different users faced while using the Data Viewer.
The main problem was that different teams had difficulty distracting and understanding the information from the data because the platform was a long list of numbers and tables with unfamiliar terms. So, we wanted to improve the user experience by visualizing the data and keeping the design consistent throughout the Data Viewer.
Source Metrics Comparison
The Source Metrics Comparison page allows the user to compare the different sources from which PlaceIQ receives data. The user can apply filters to the list and export the list as a CSV file.

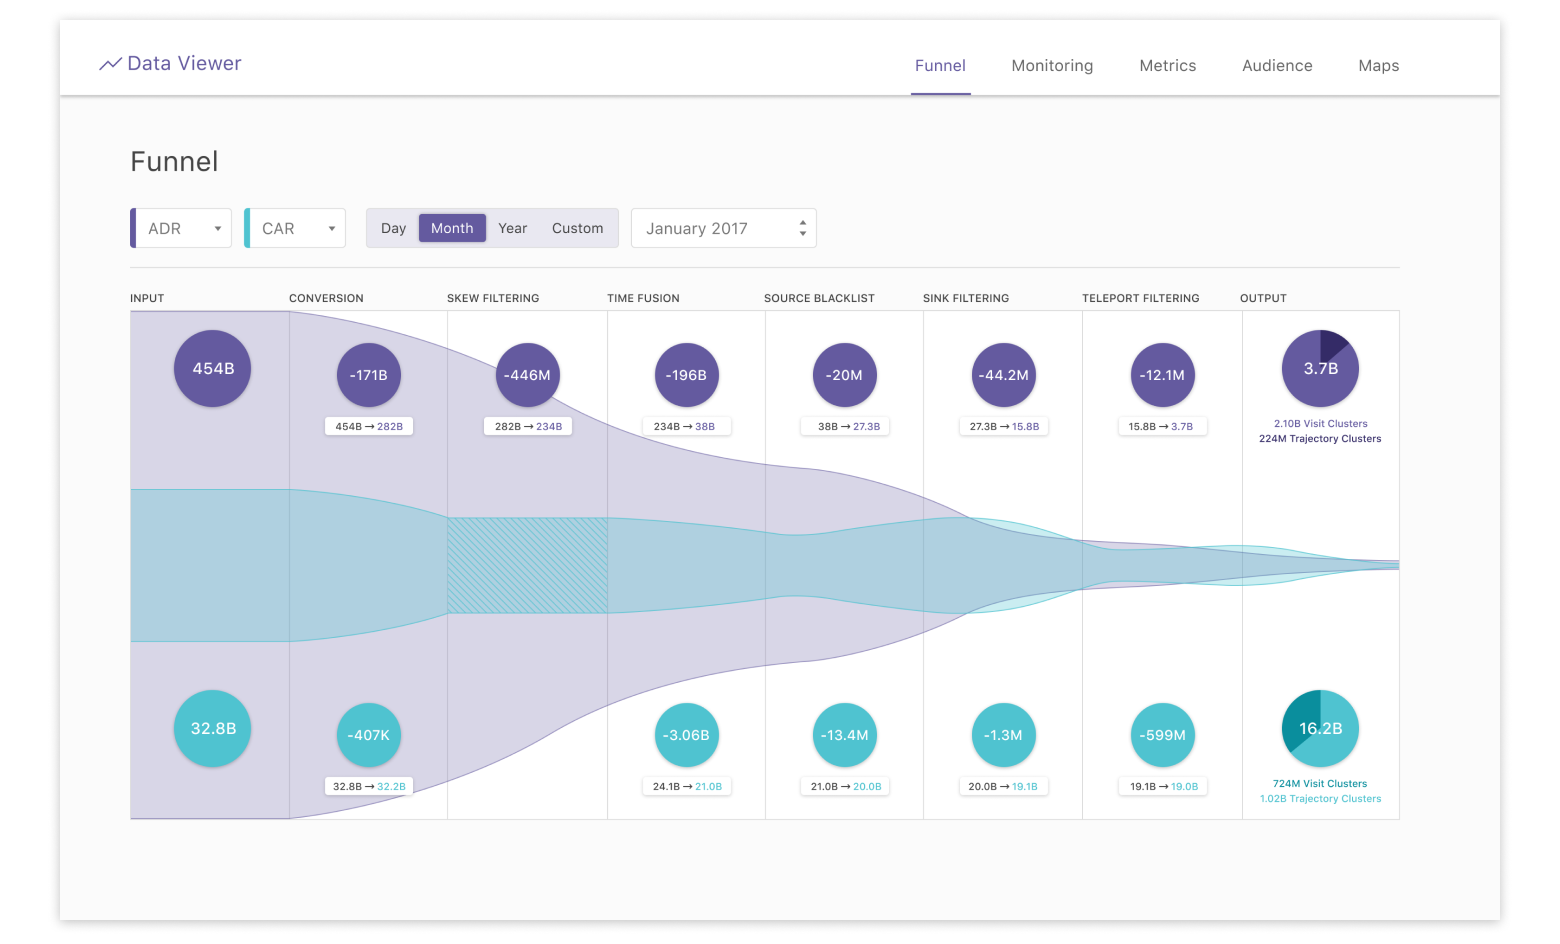
Funnel
The Funnel page allows the user to select two different sources to compare from a specific time frame, visually displaying the data filtering process for each source.
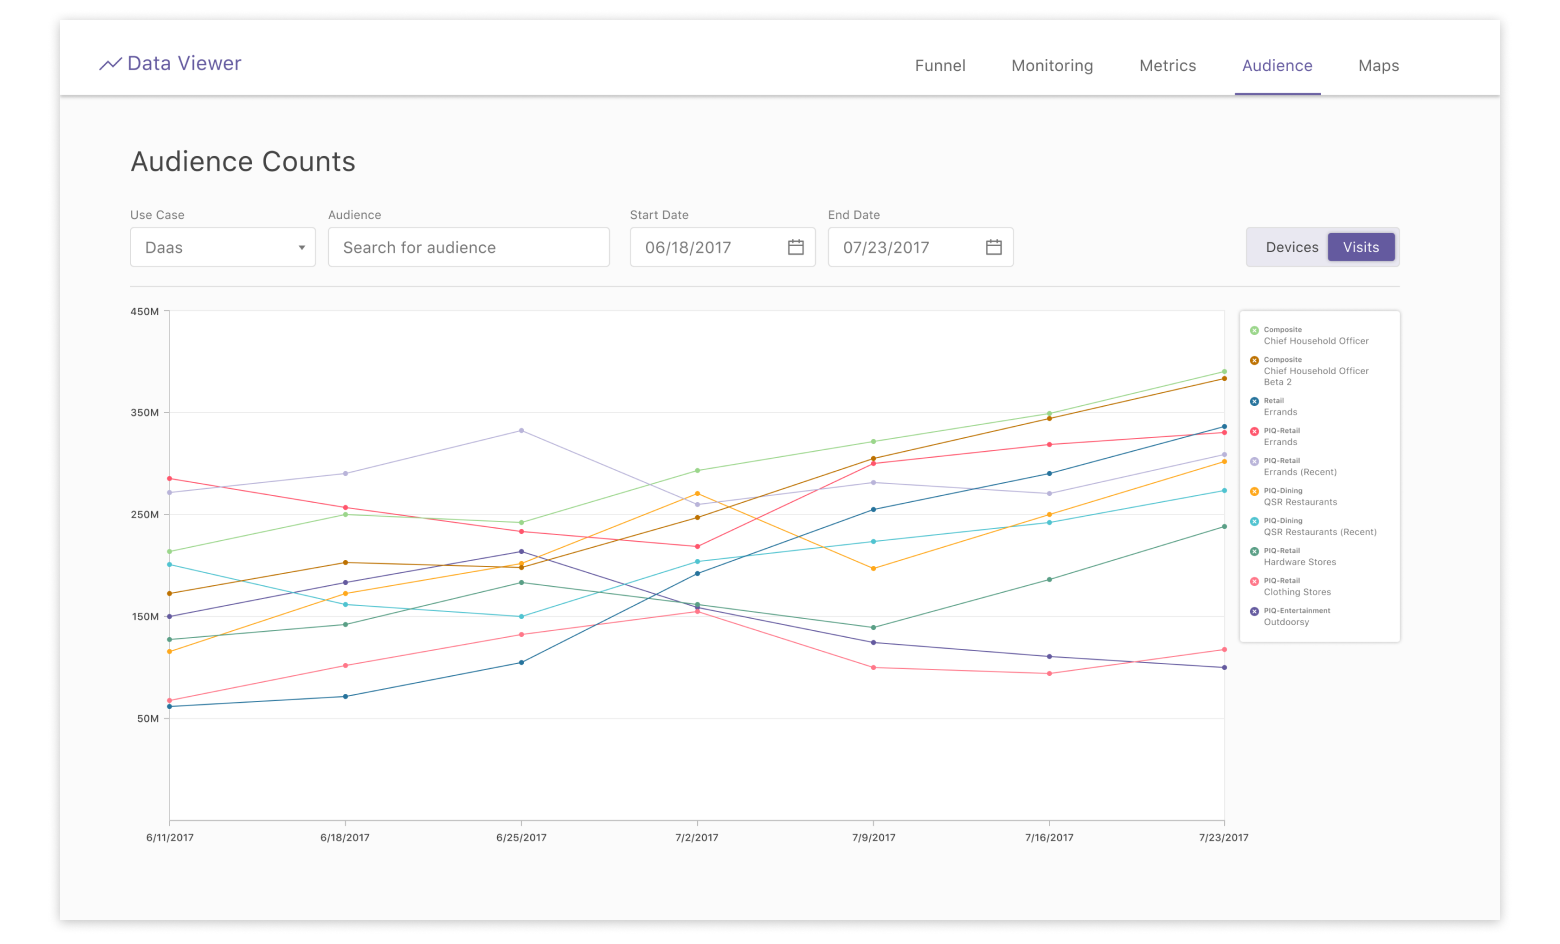
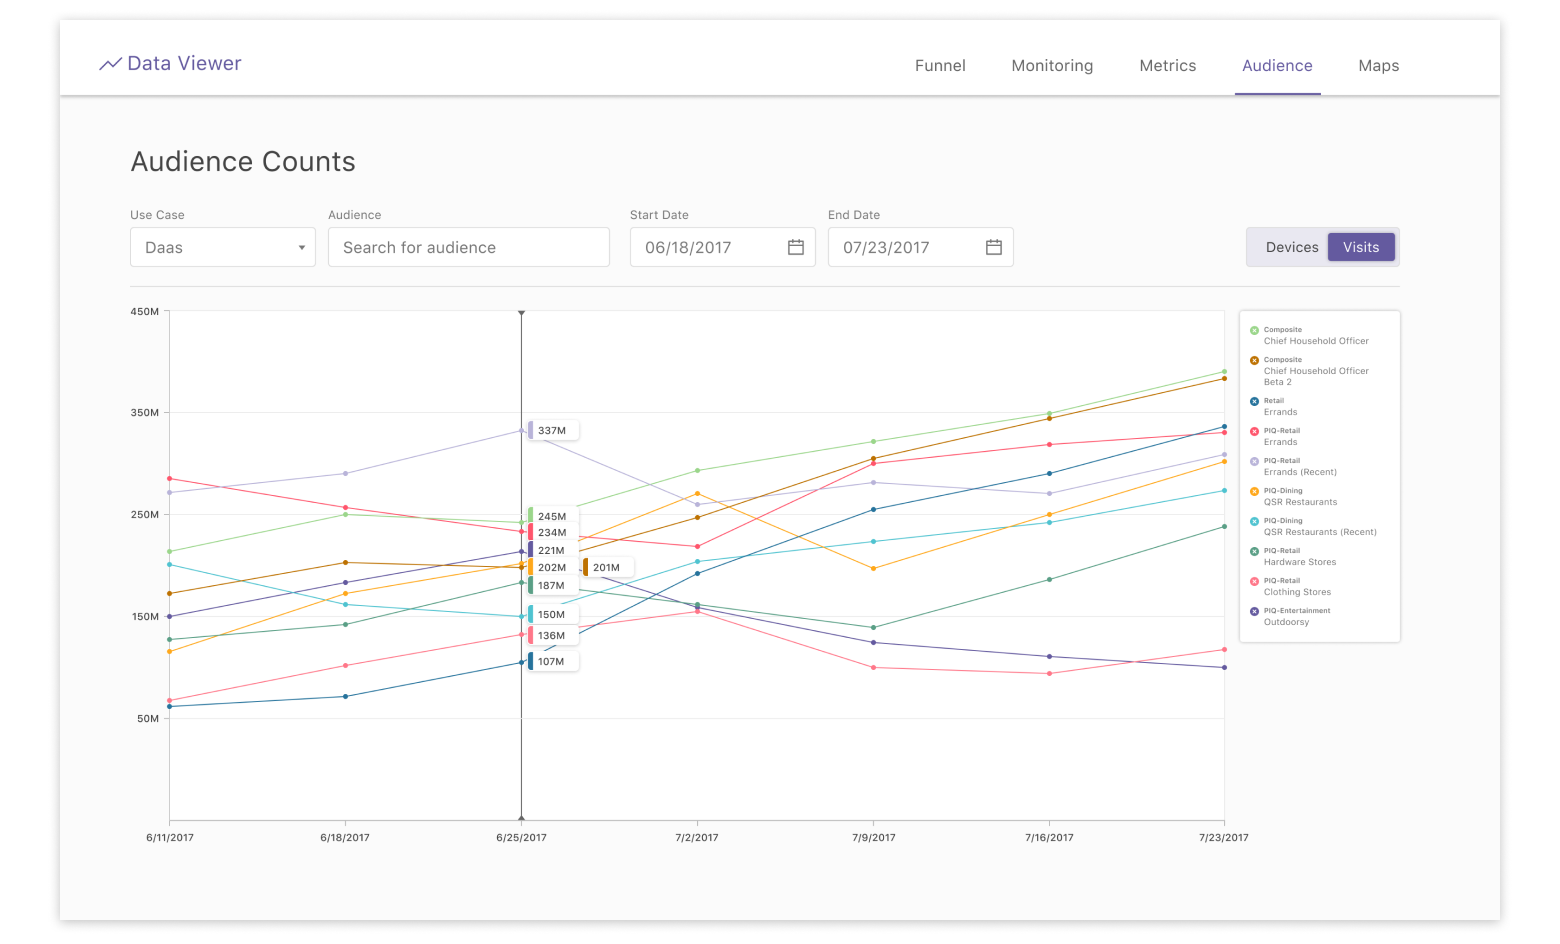
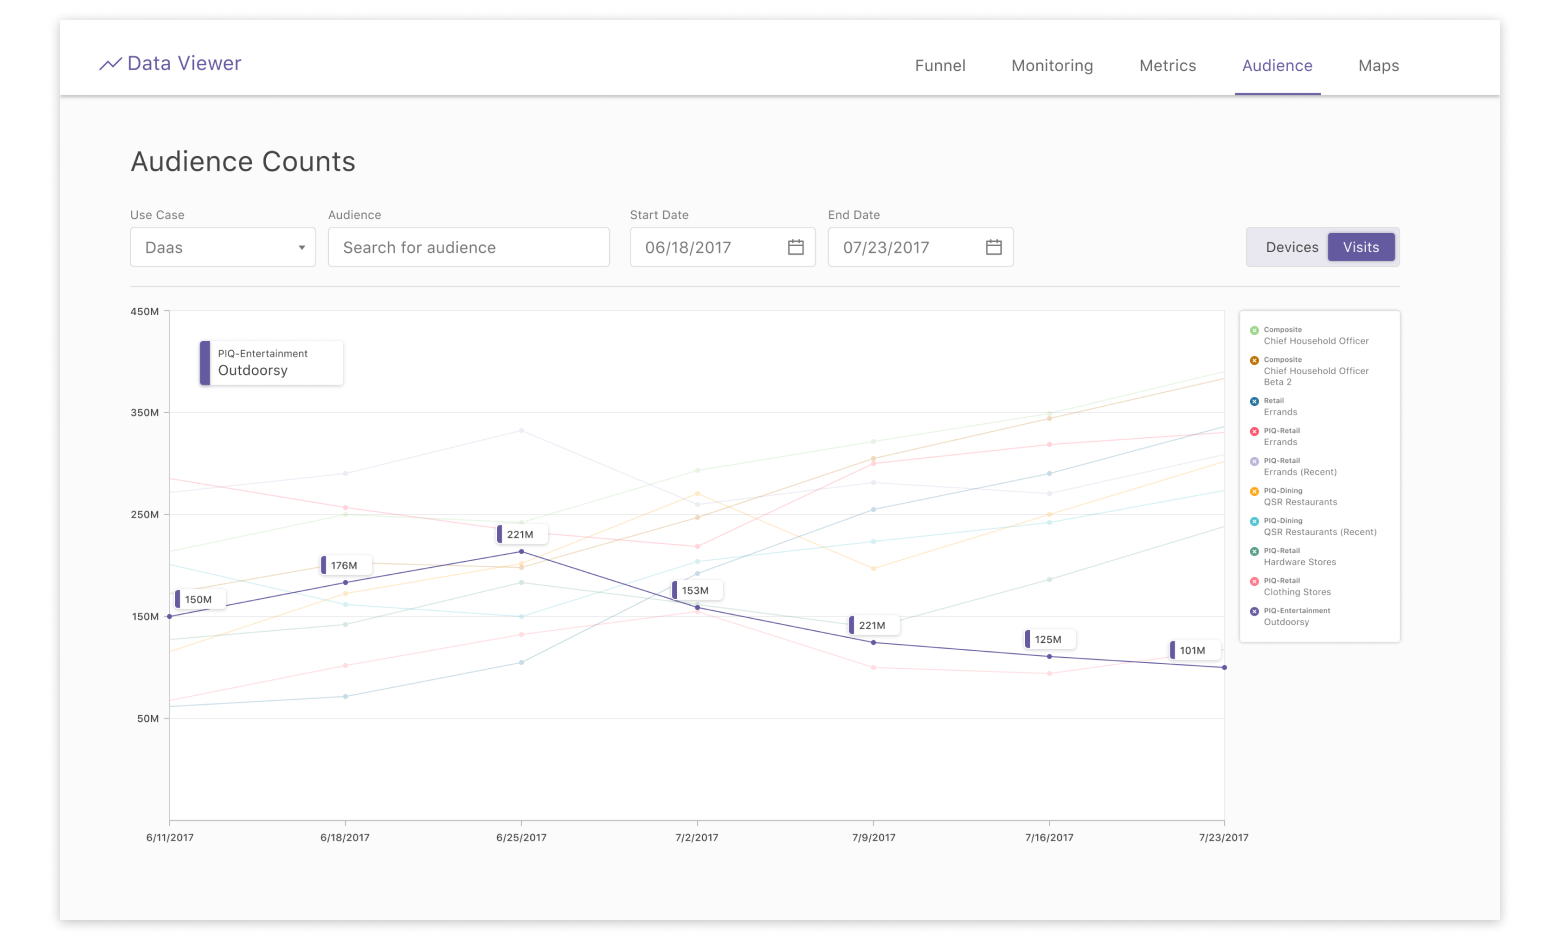
Audience Counts
The Audience Counts page displays up to ten different audiences over a specific time frame, allowing the user to analyze the different audience counts and patterns over time. The user can customize which audiences to display and hover over the graph to view the audience counts.
Final Thoughts
The team had to pause the project because other high-priority projects were going on at the same time, but it was a great learning experience, being able to collaborate with different teams to push for a better user experience for the Data Viewer.